Milky Way from Perseus to Cassiopeia
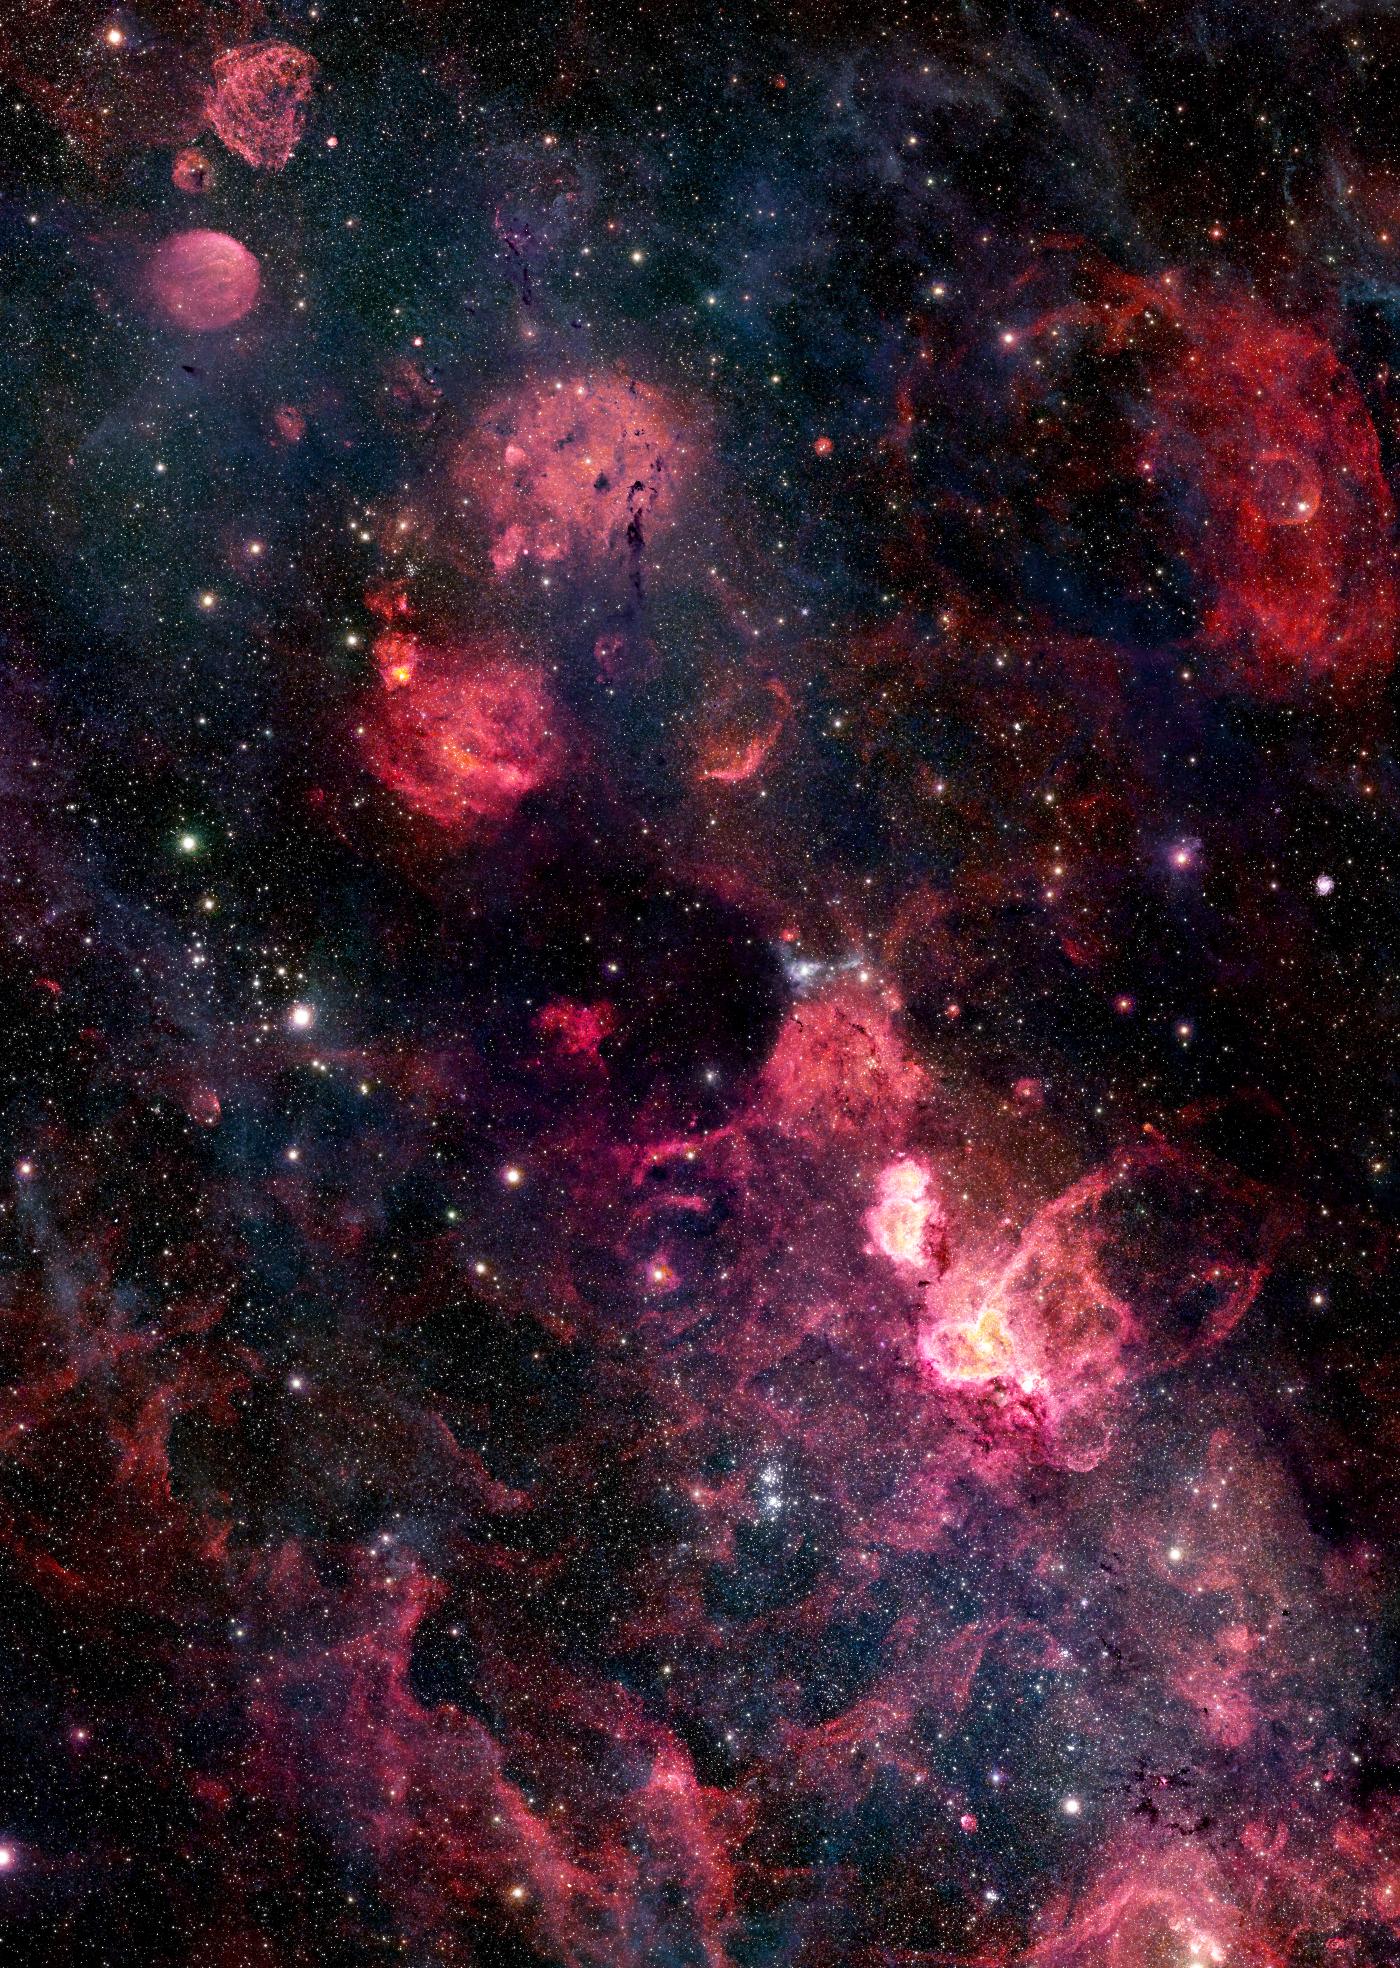
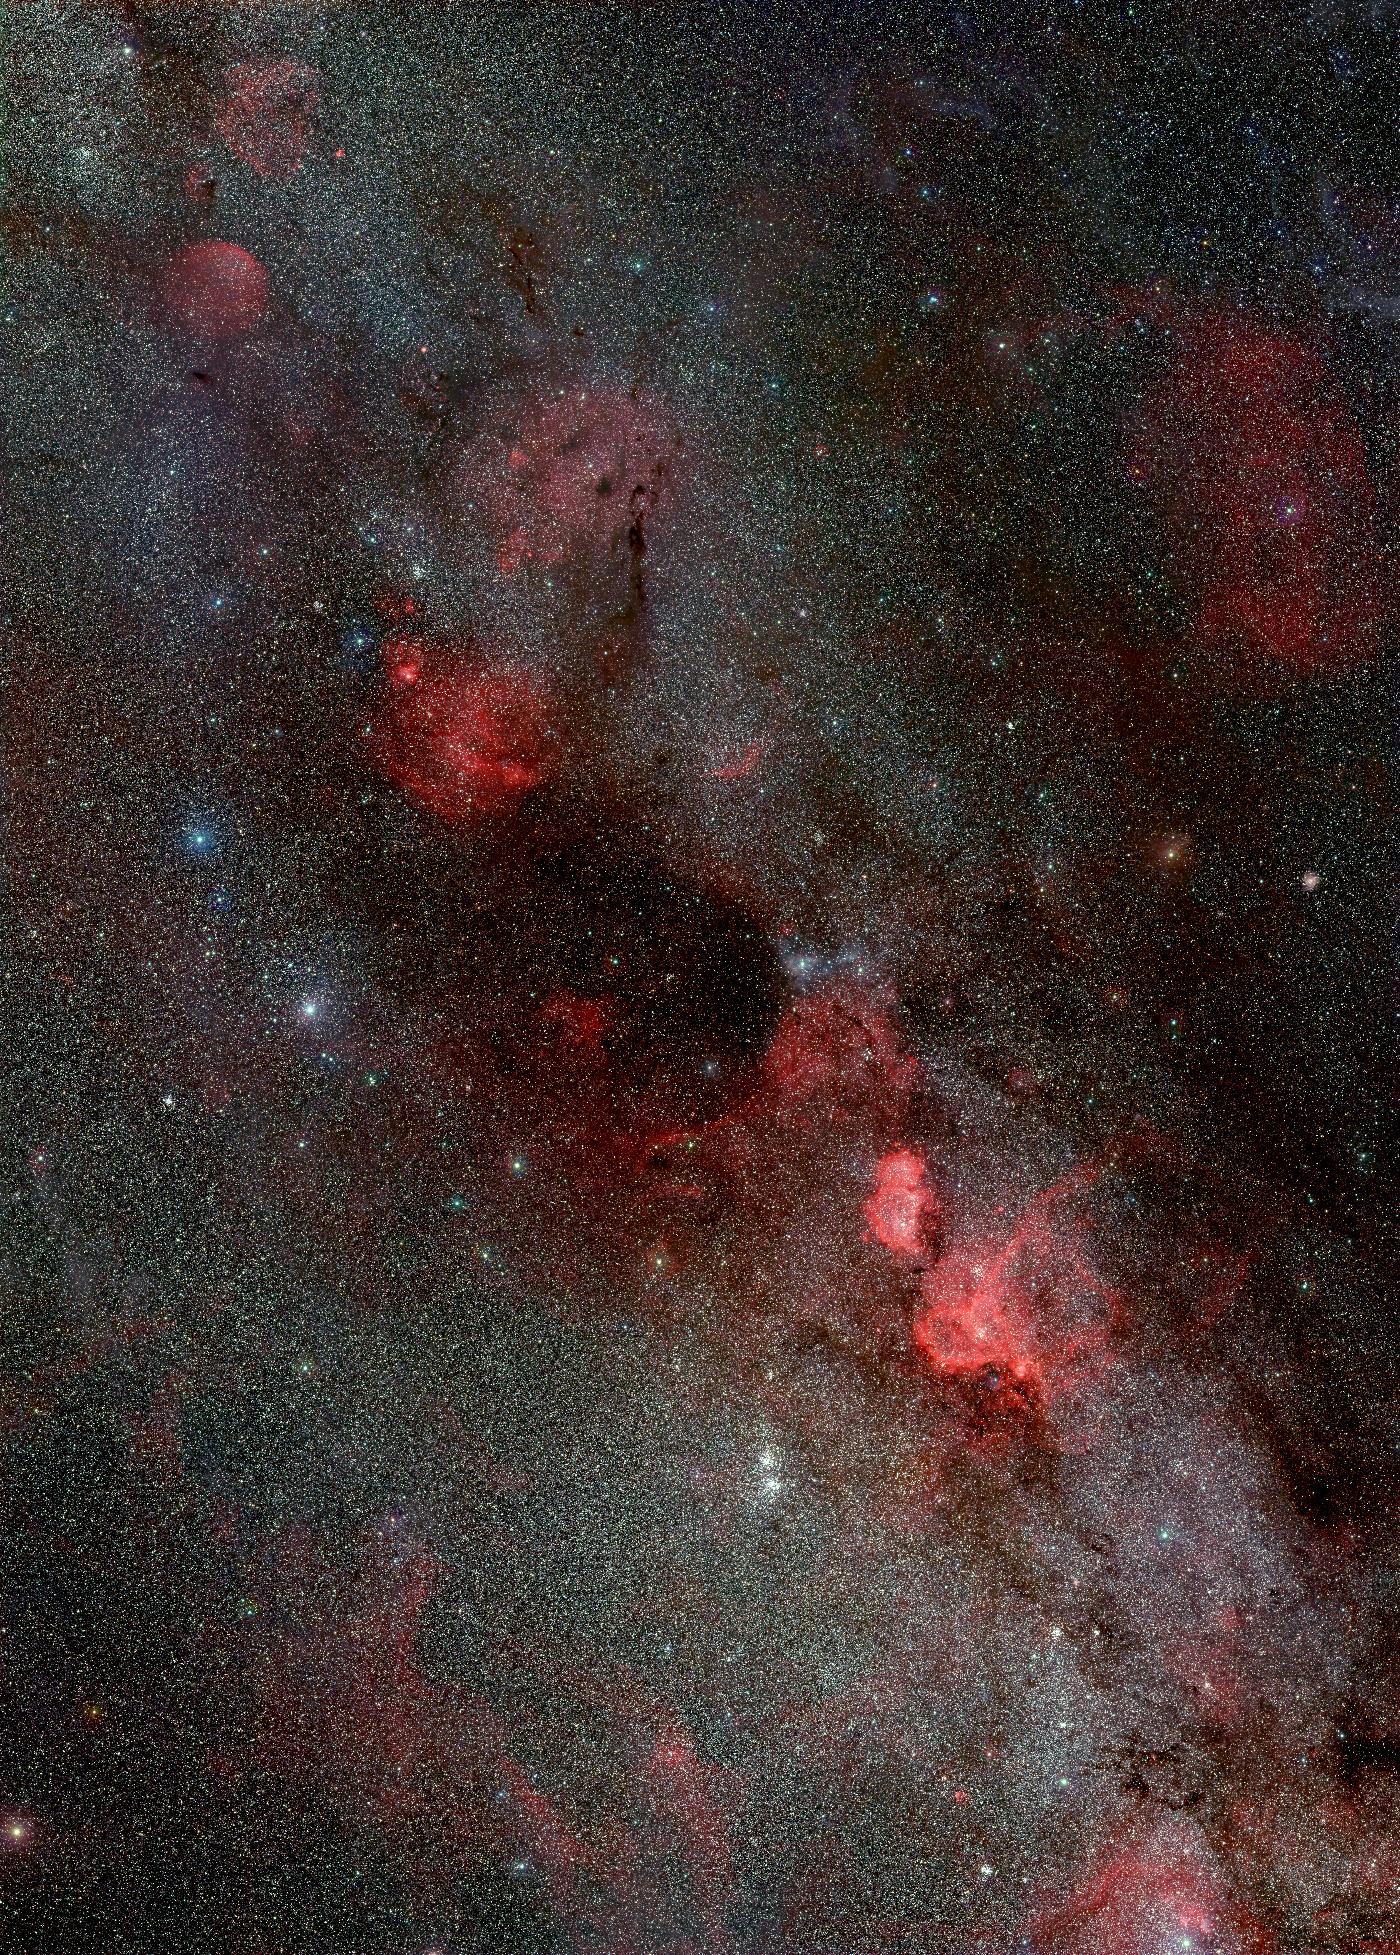
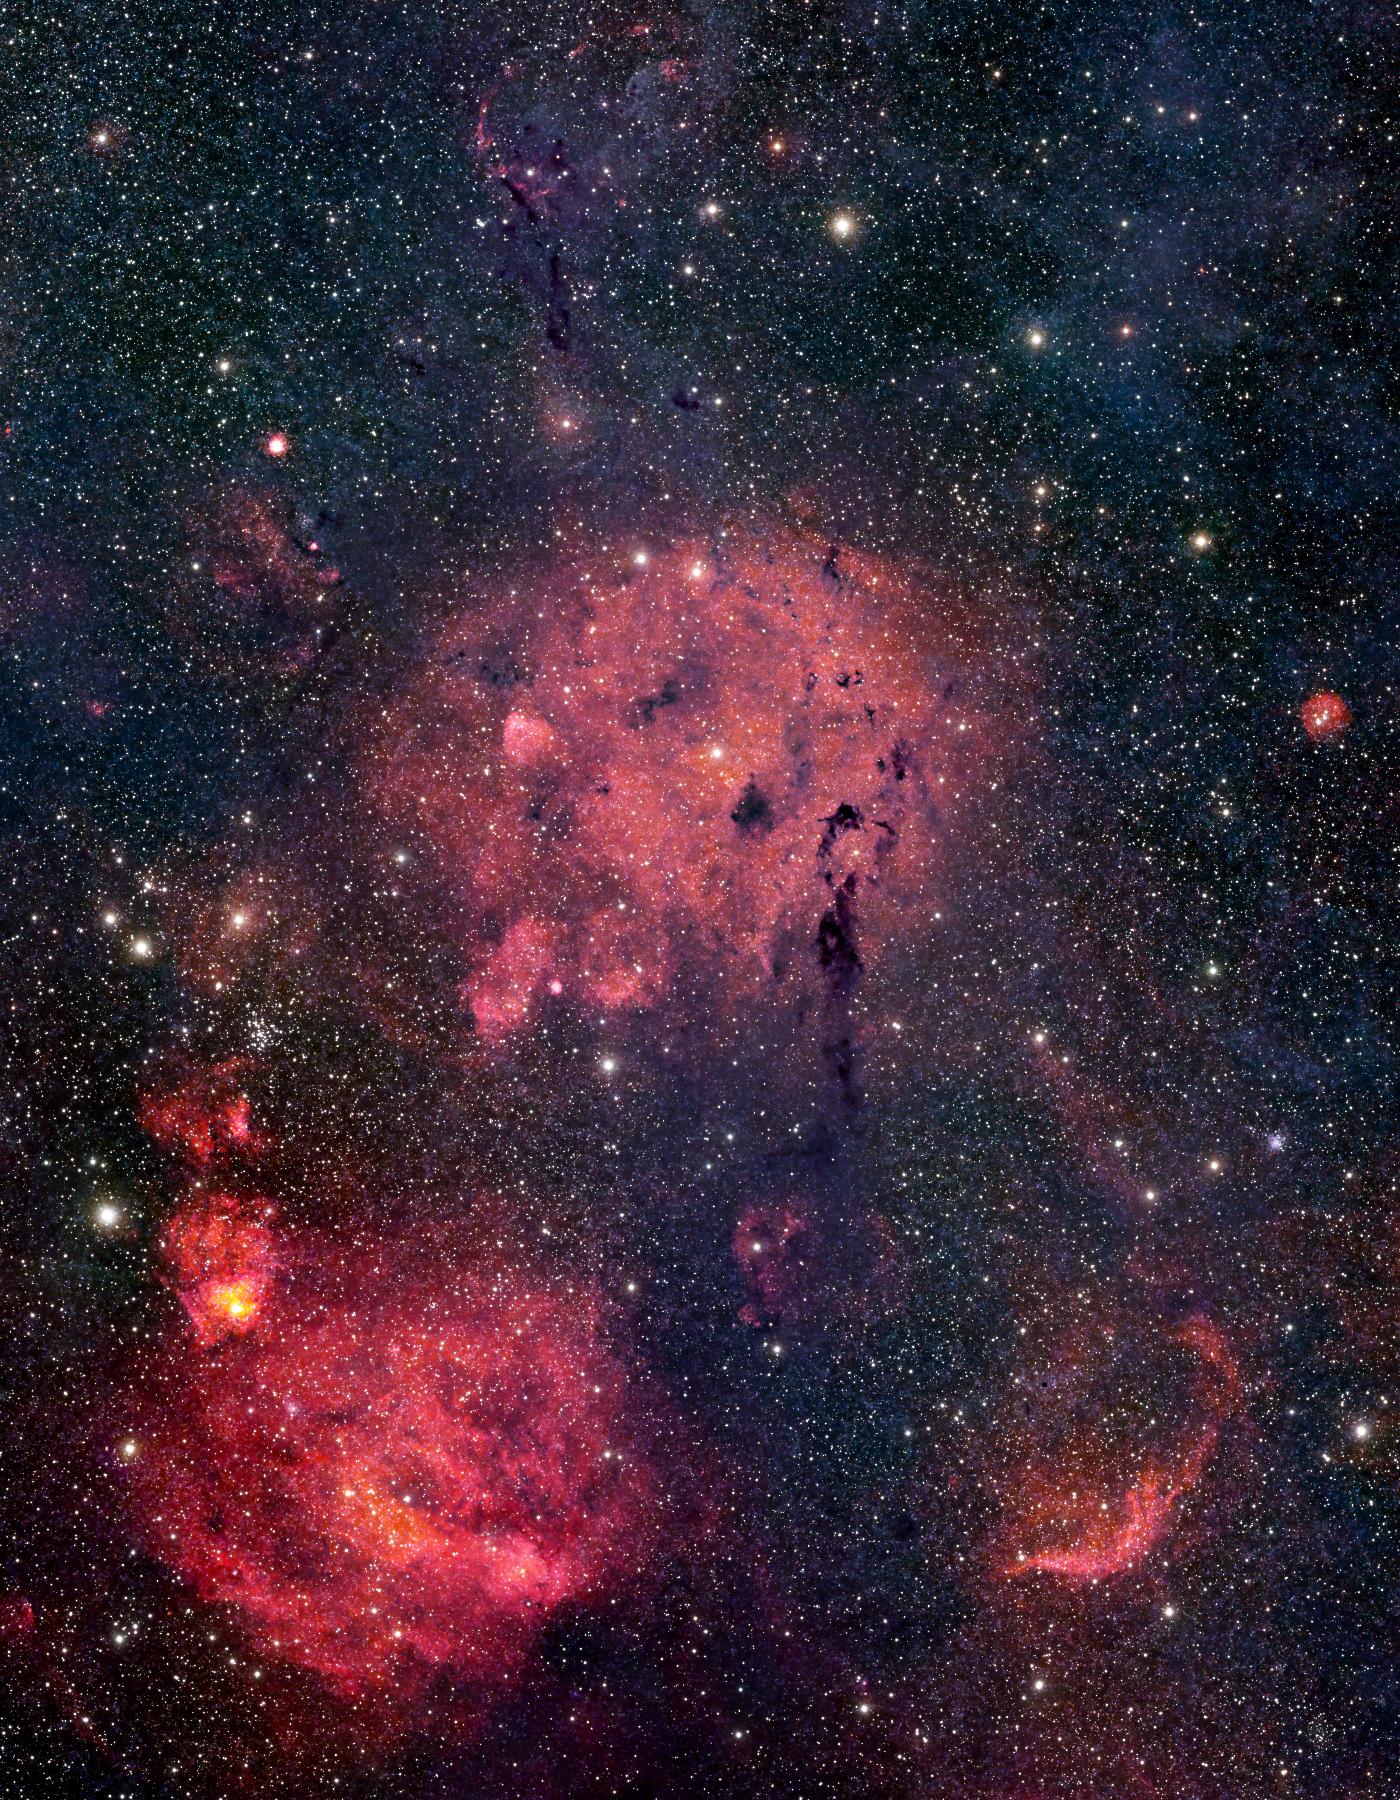
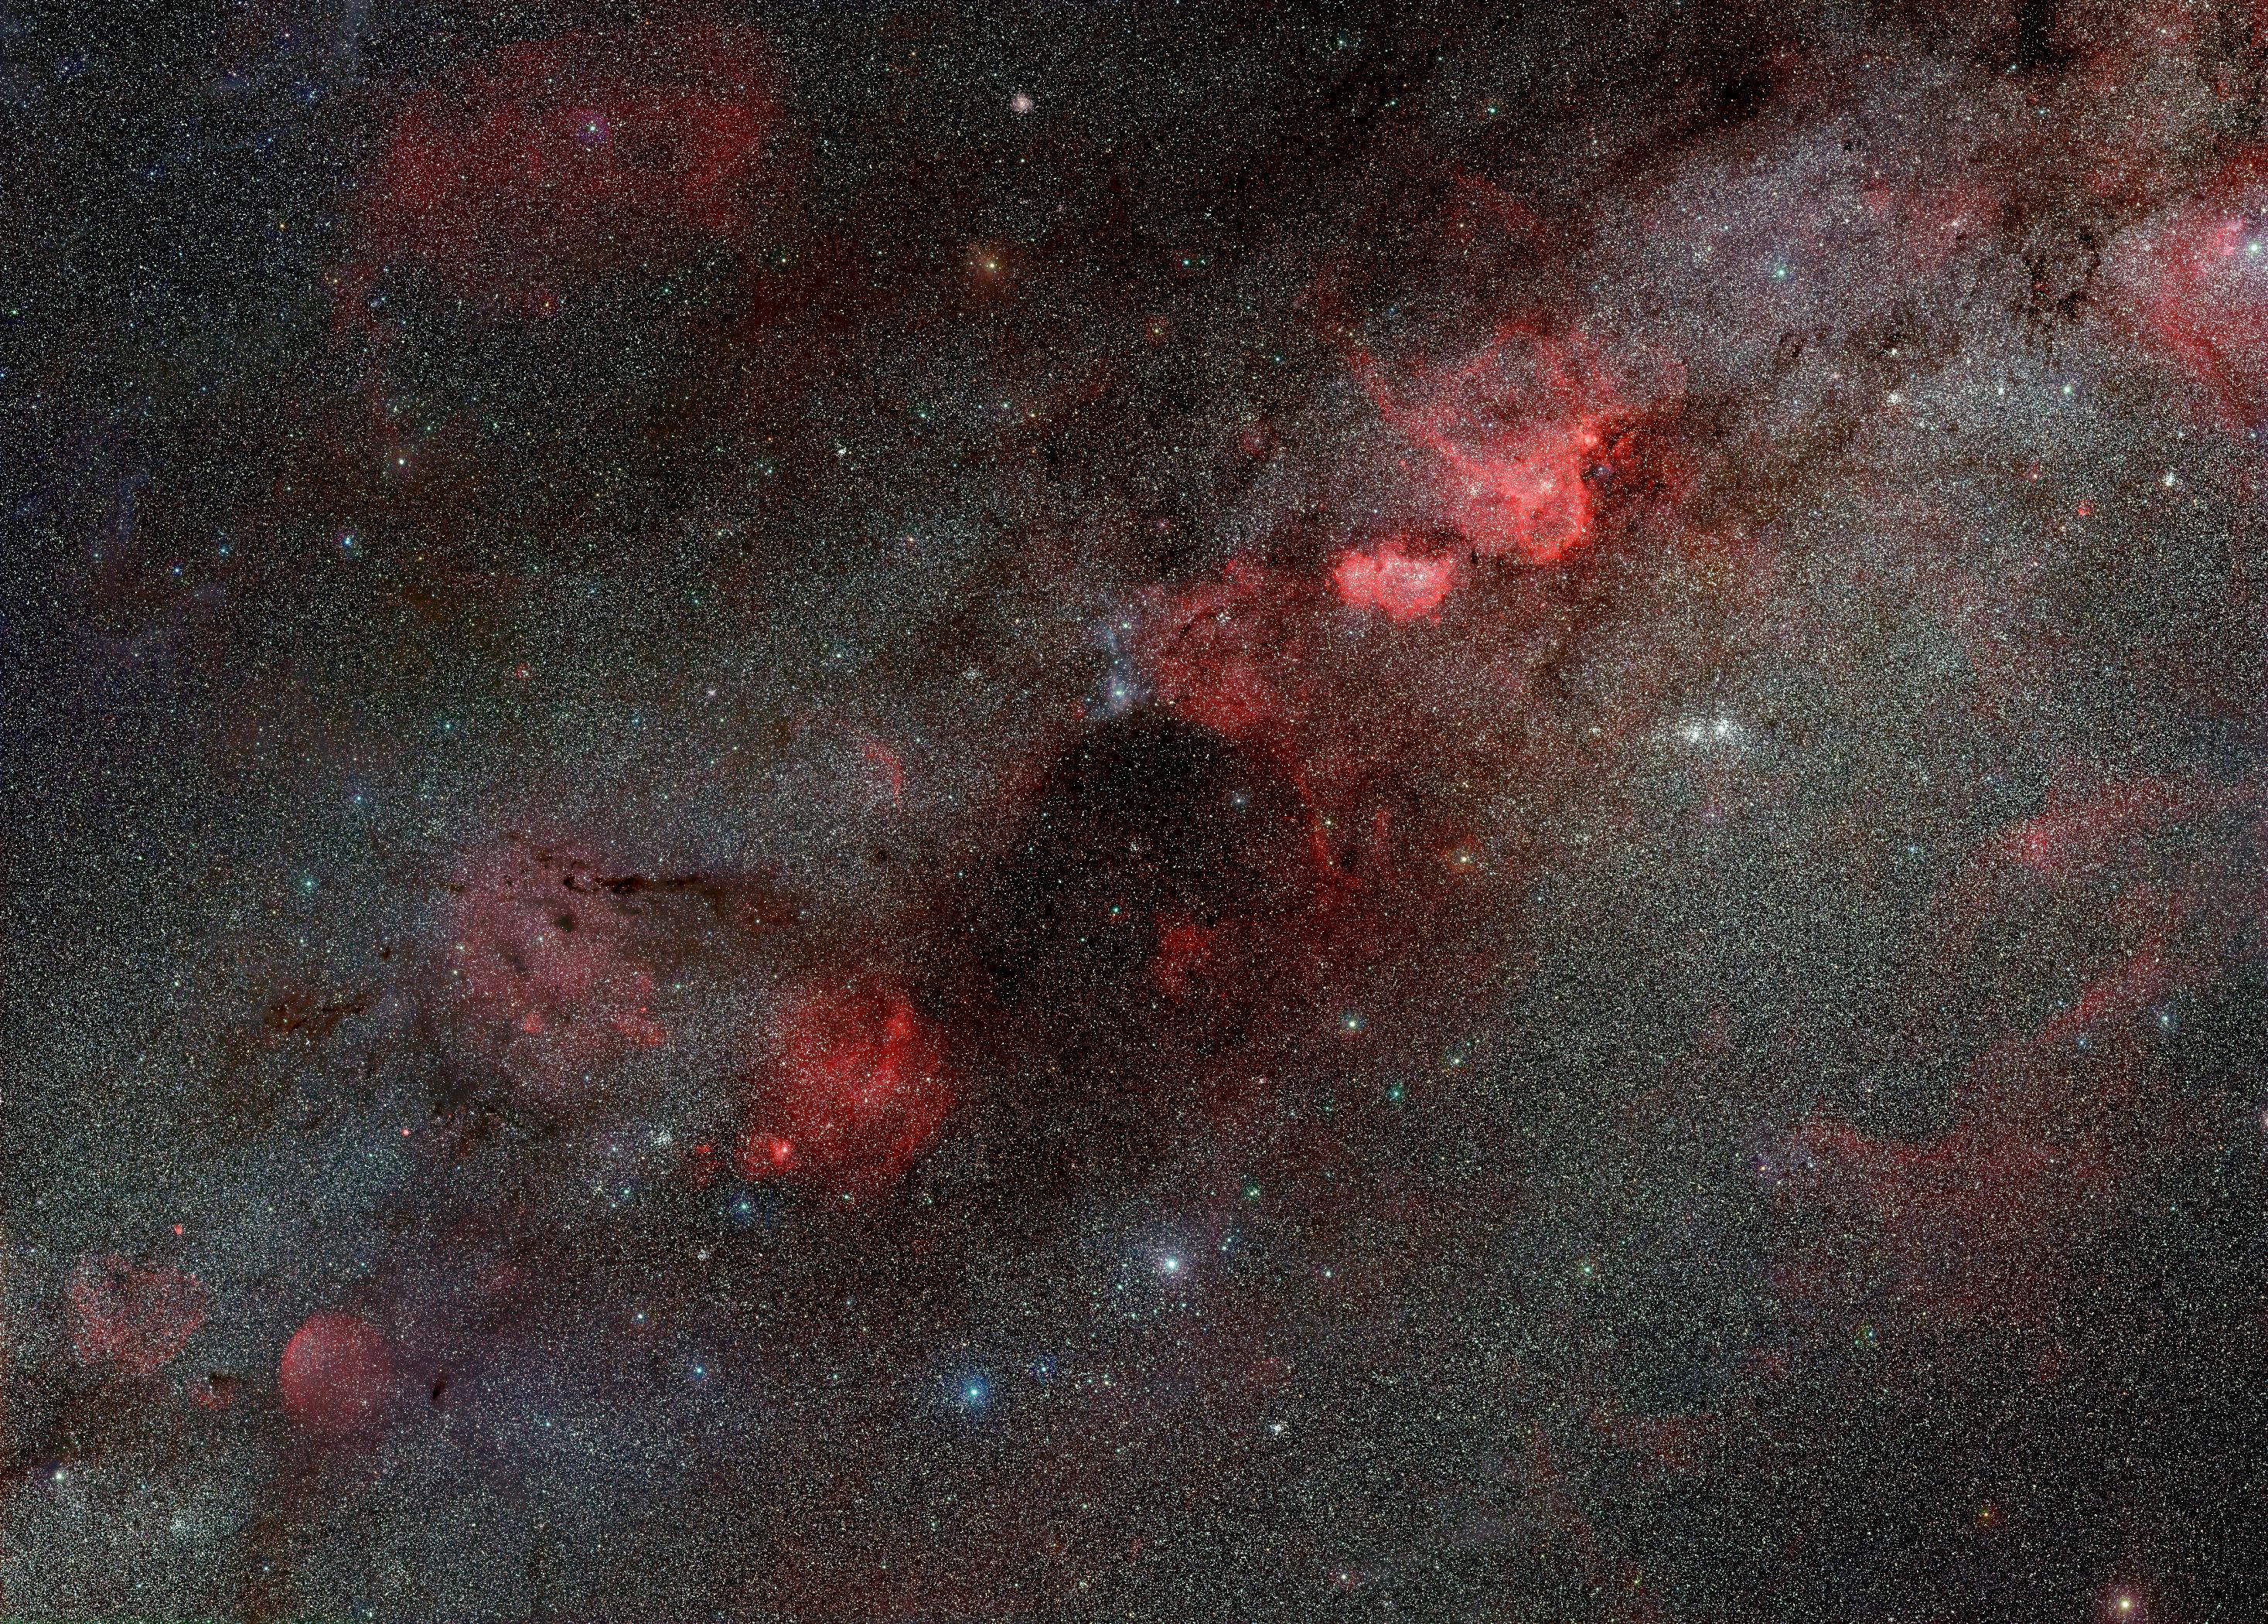
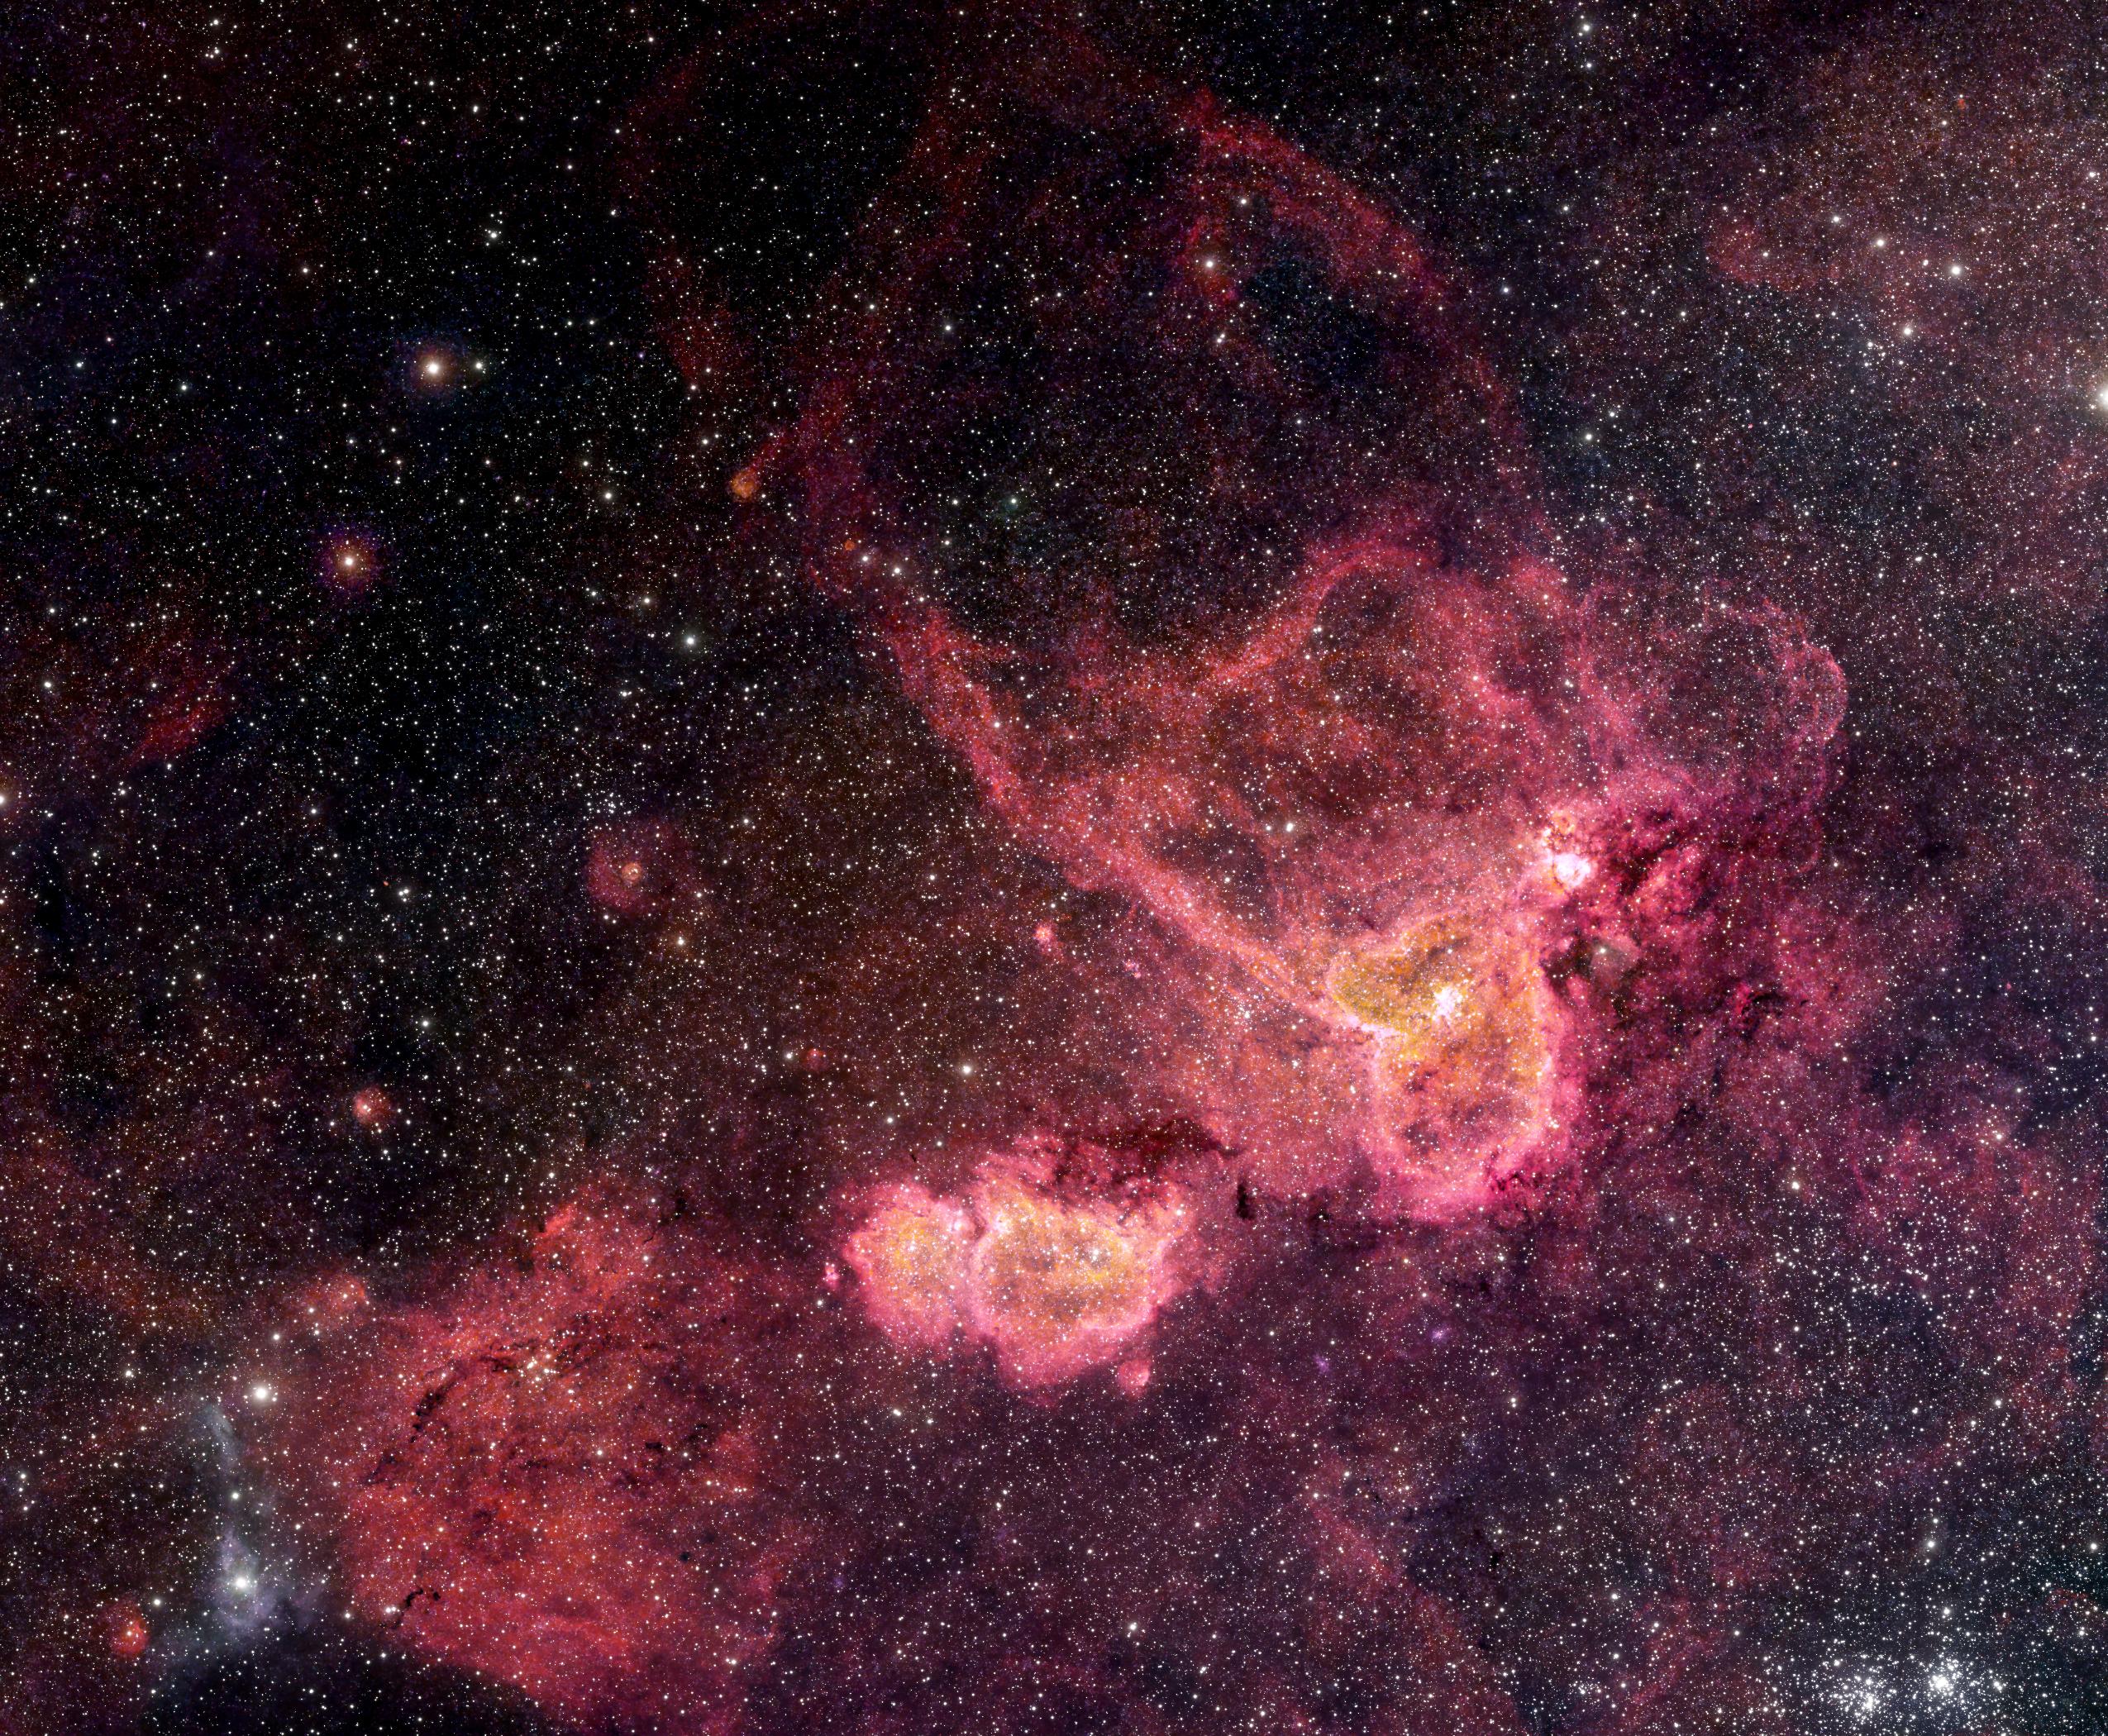
On this page a 35°×25° wide-field view of the Milky Way in constellations Perseus, Camelopardalis and Cassiopeia is presented in different color composites. This region is full of known and unknown nebulae.
All pictures below are downscaled versions. Full resolution images with more than 100 megapixels can be loaded with a Javascript viewer by clicking on the images in the first section. Selected details are shown in the second section. The third section presents some discoveries. Image and instrument data can be found at the end of this page.
Full views
Click on the images to load a full resolution version with more than 100 megapixels using a JavaScript viewer.
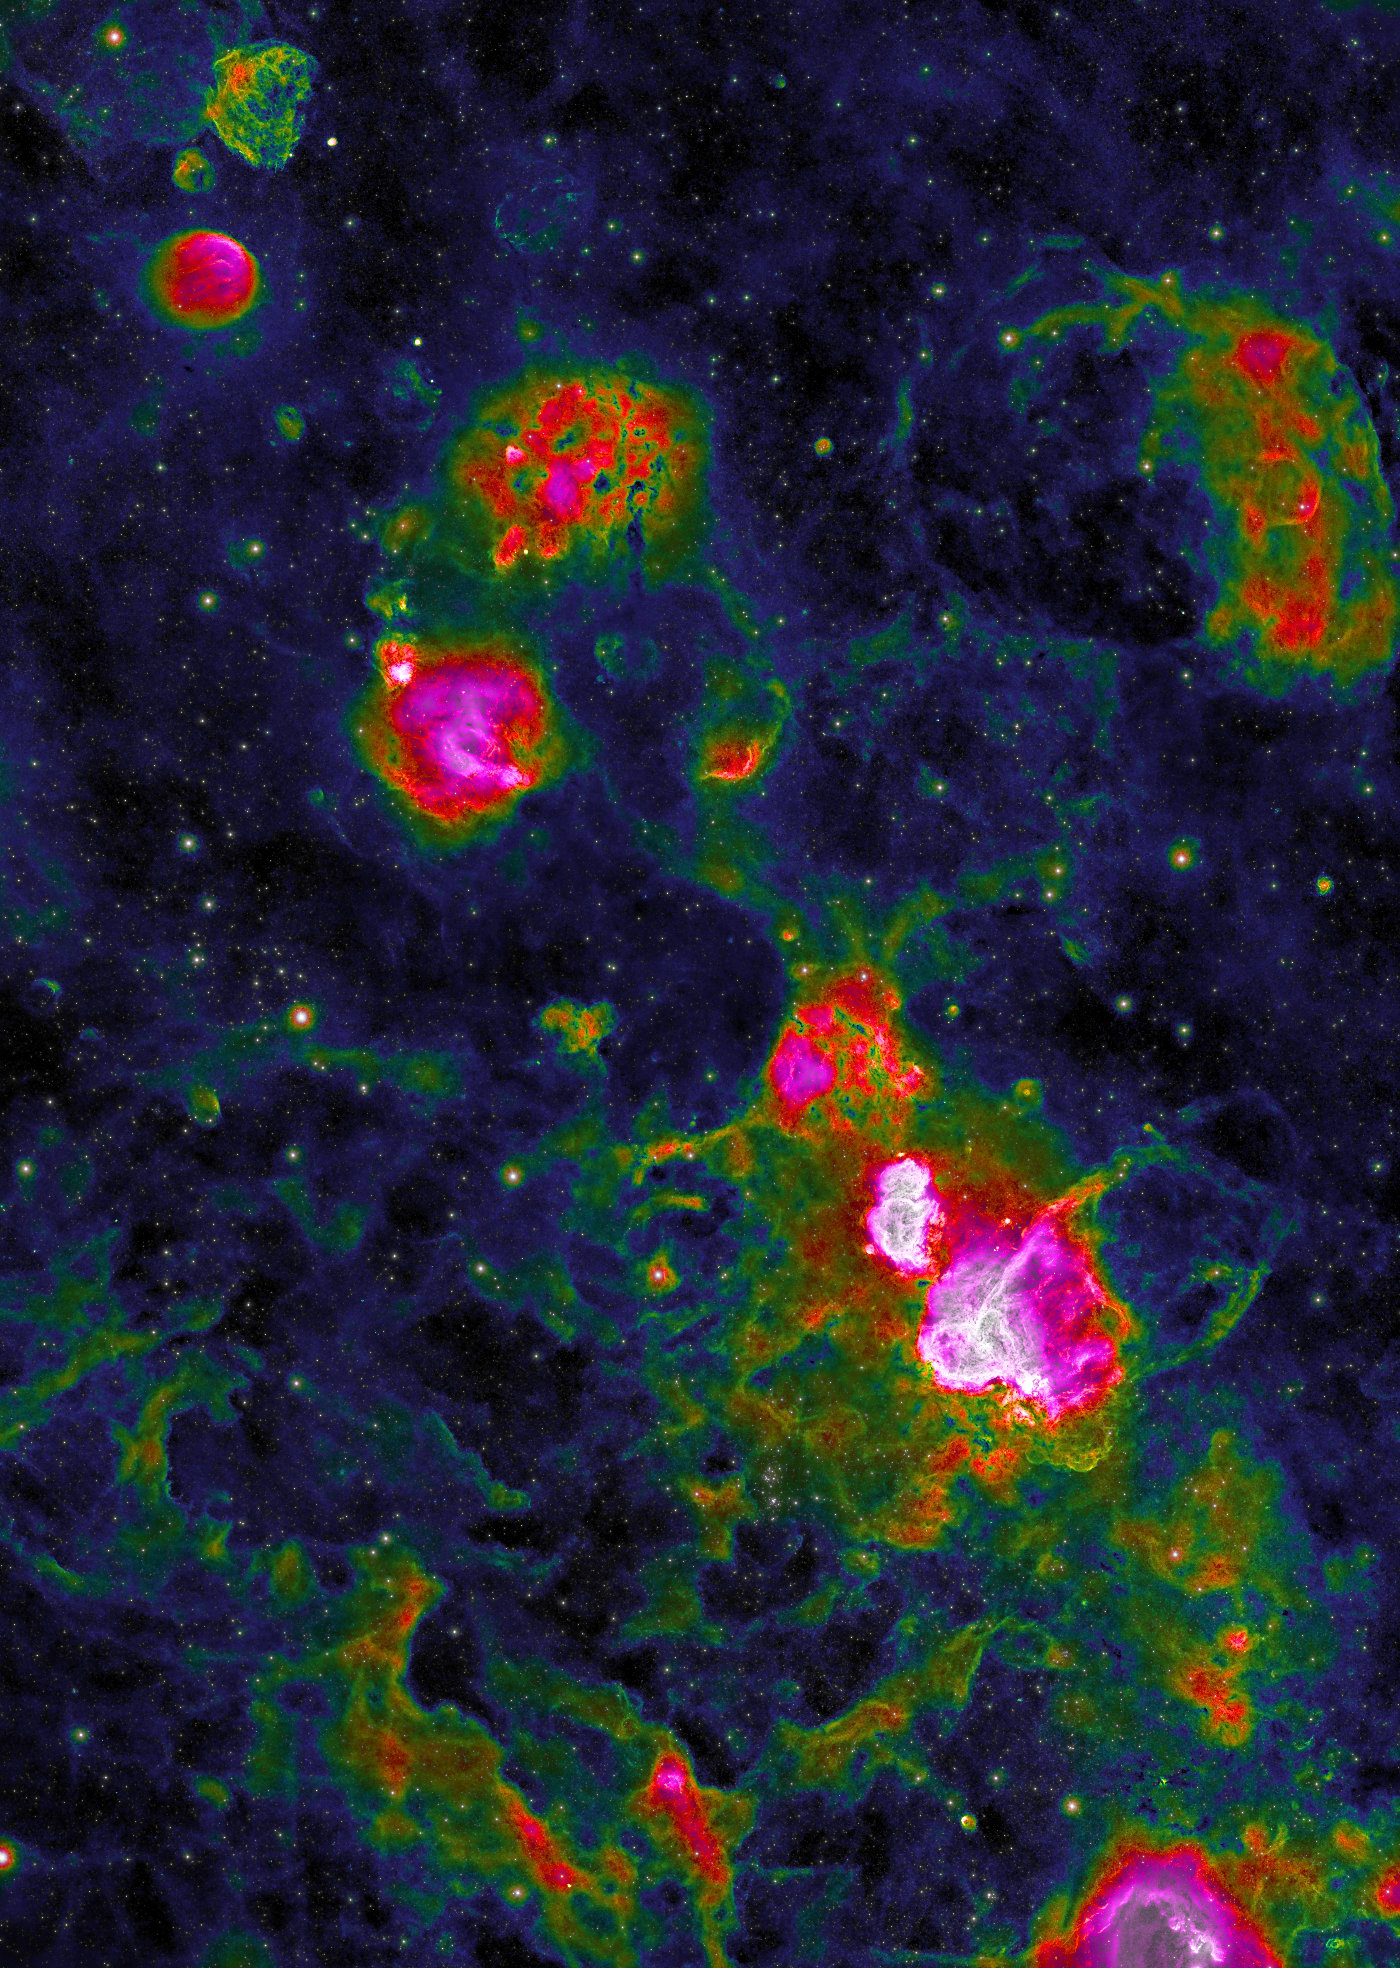

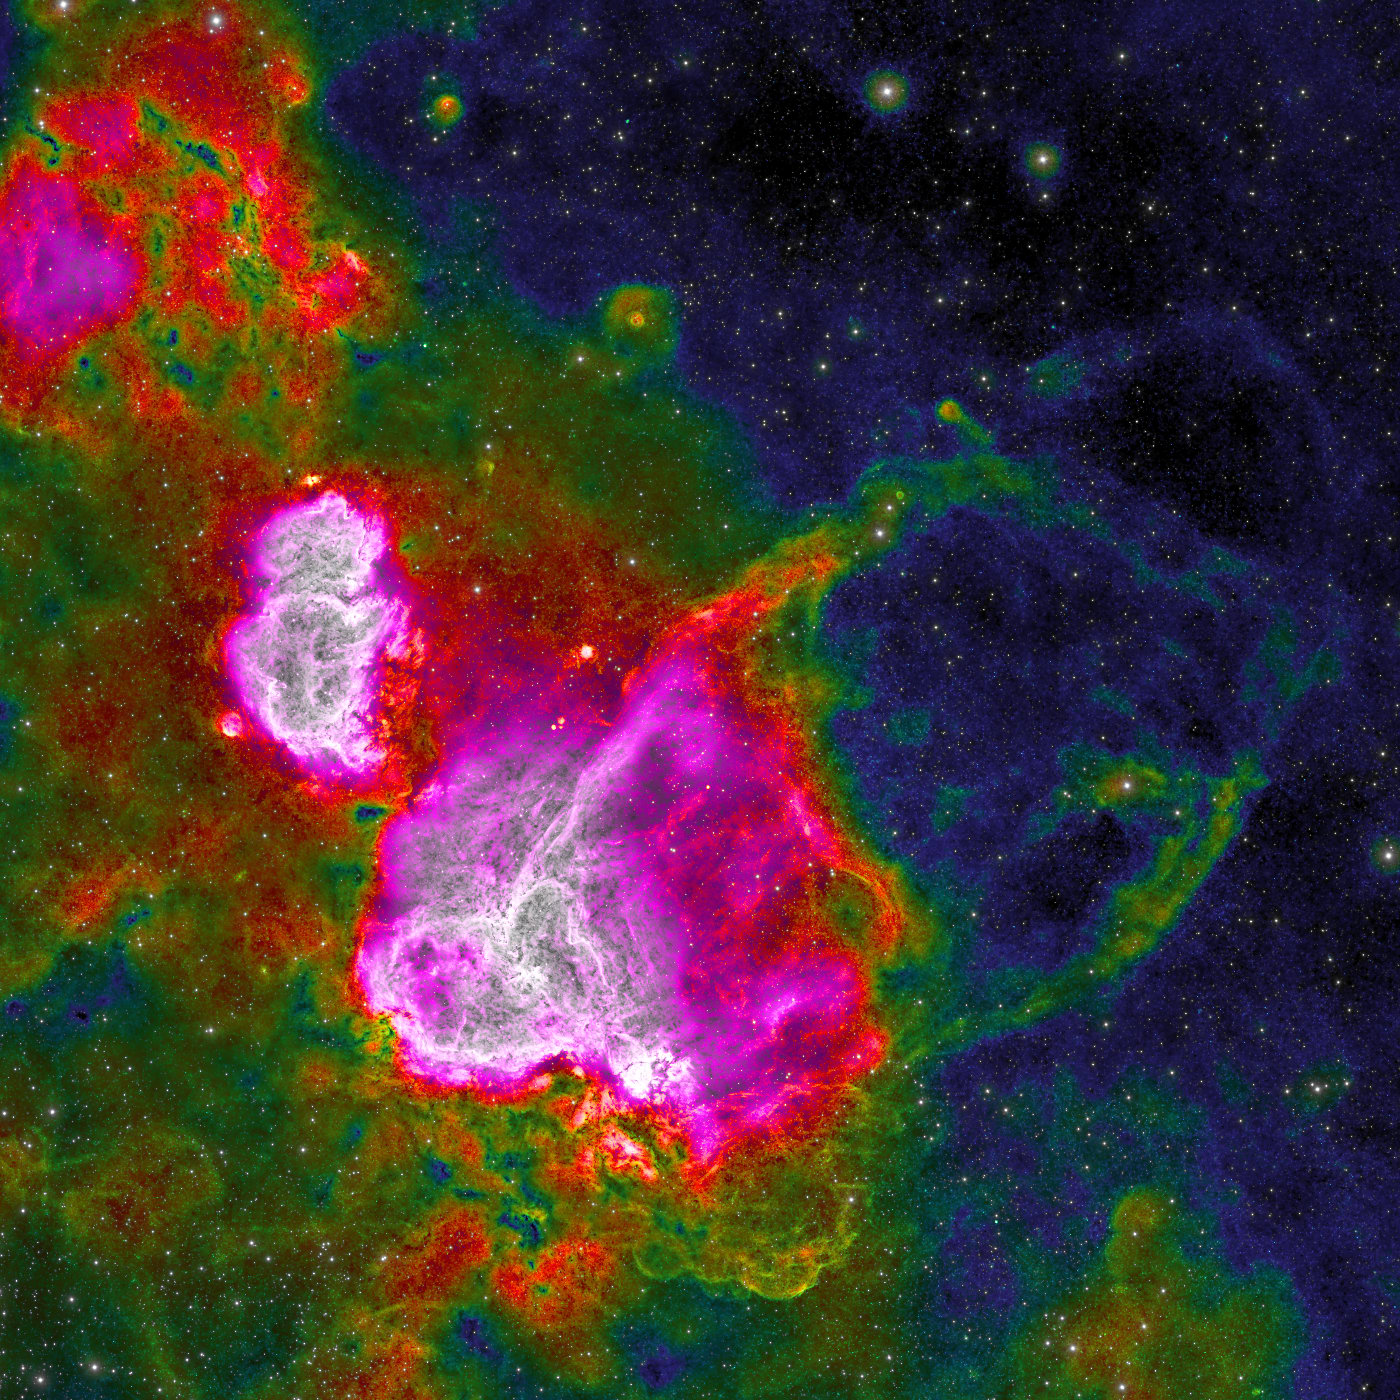
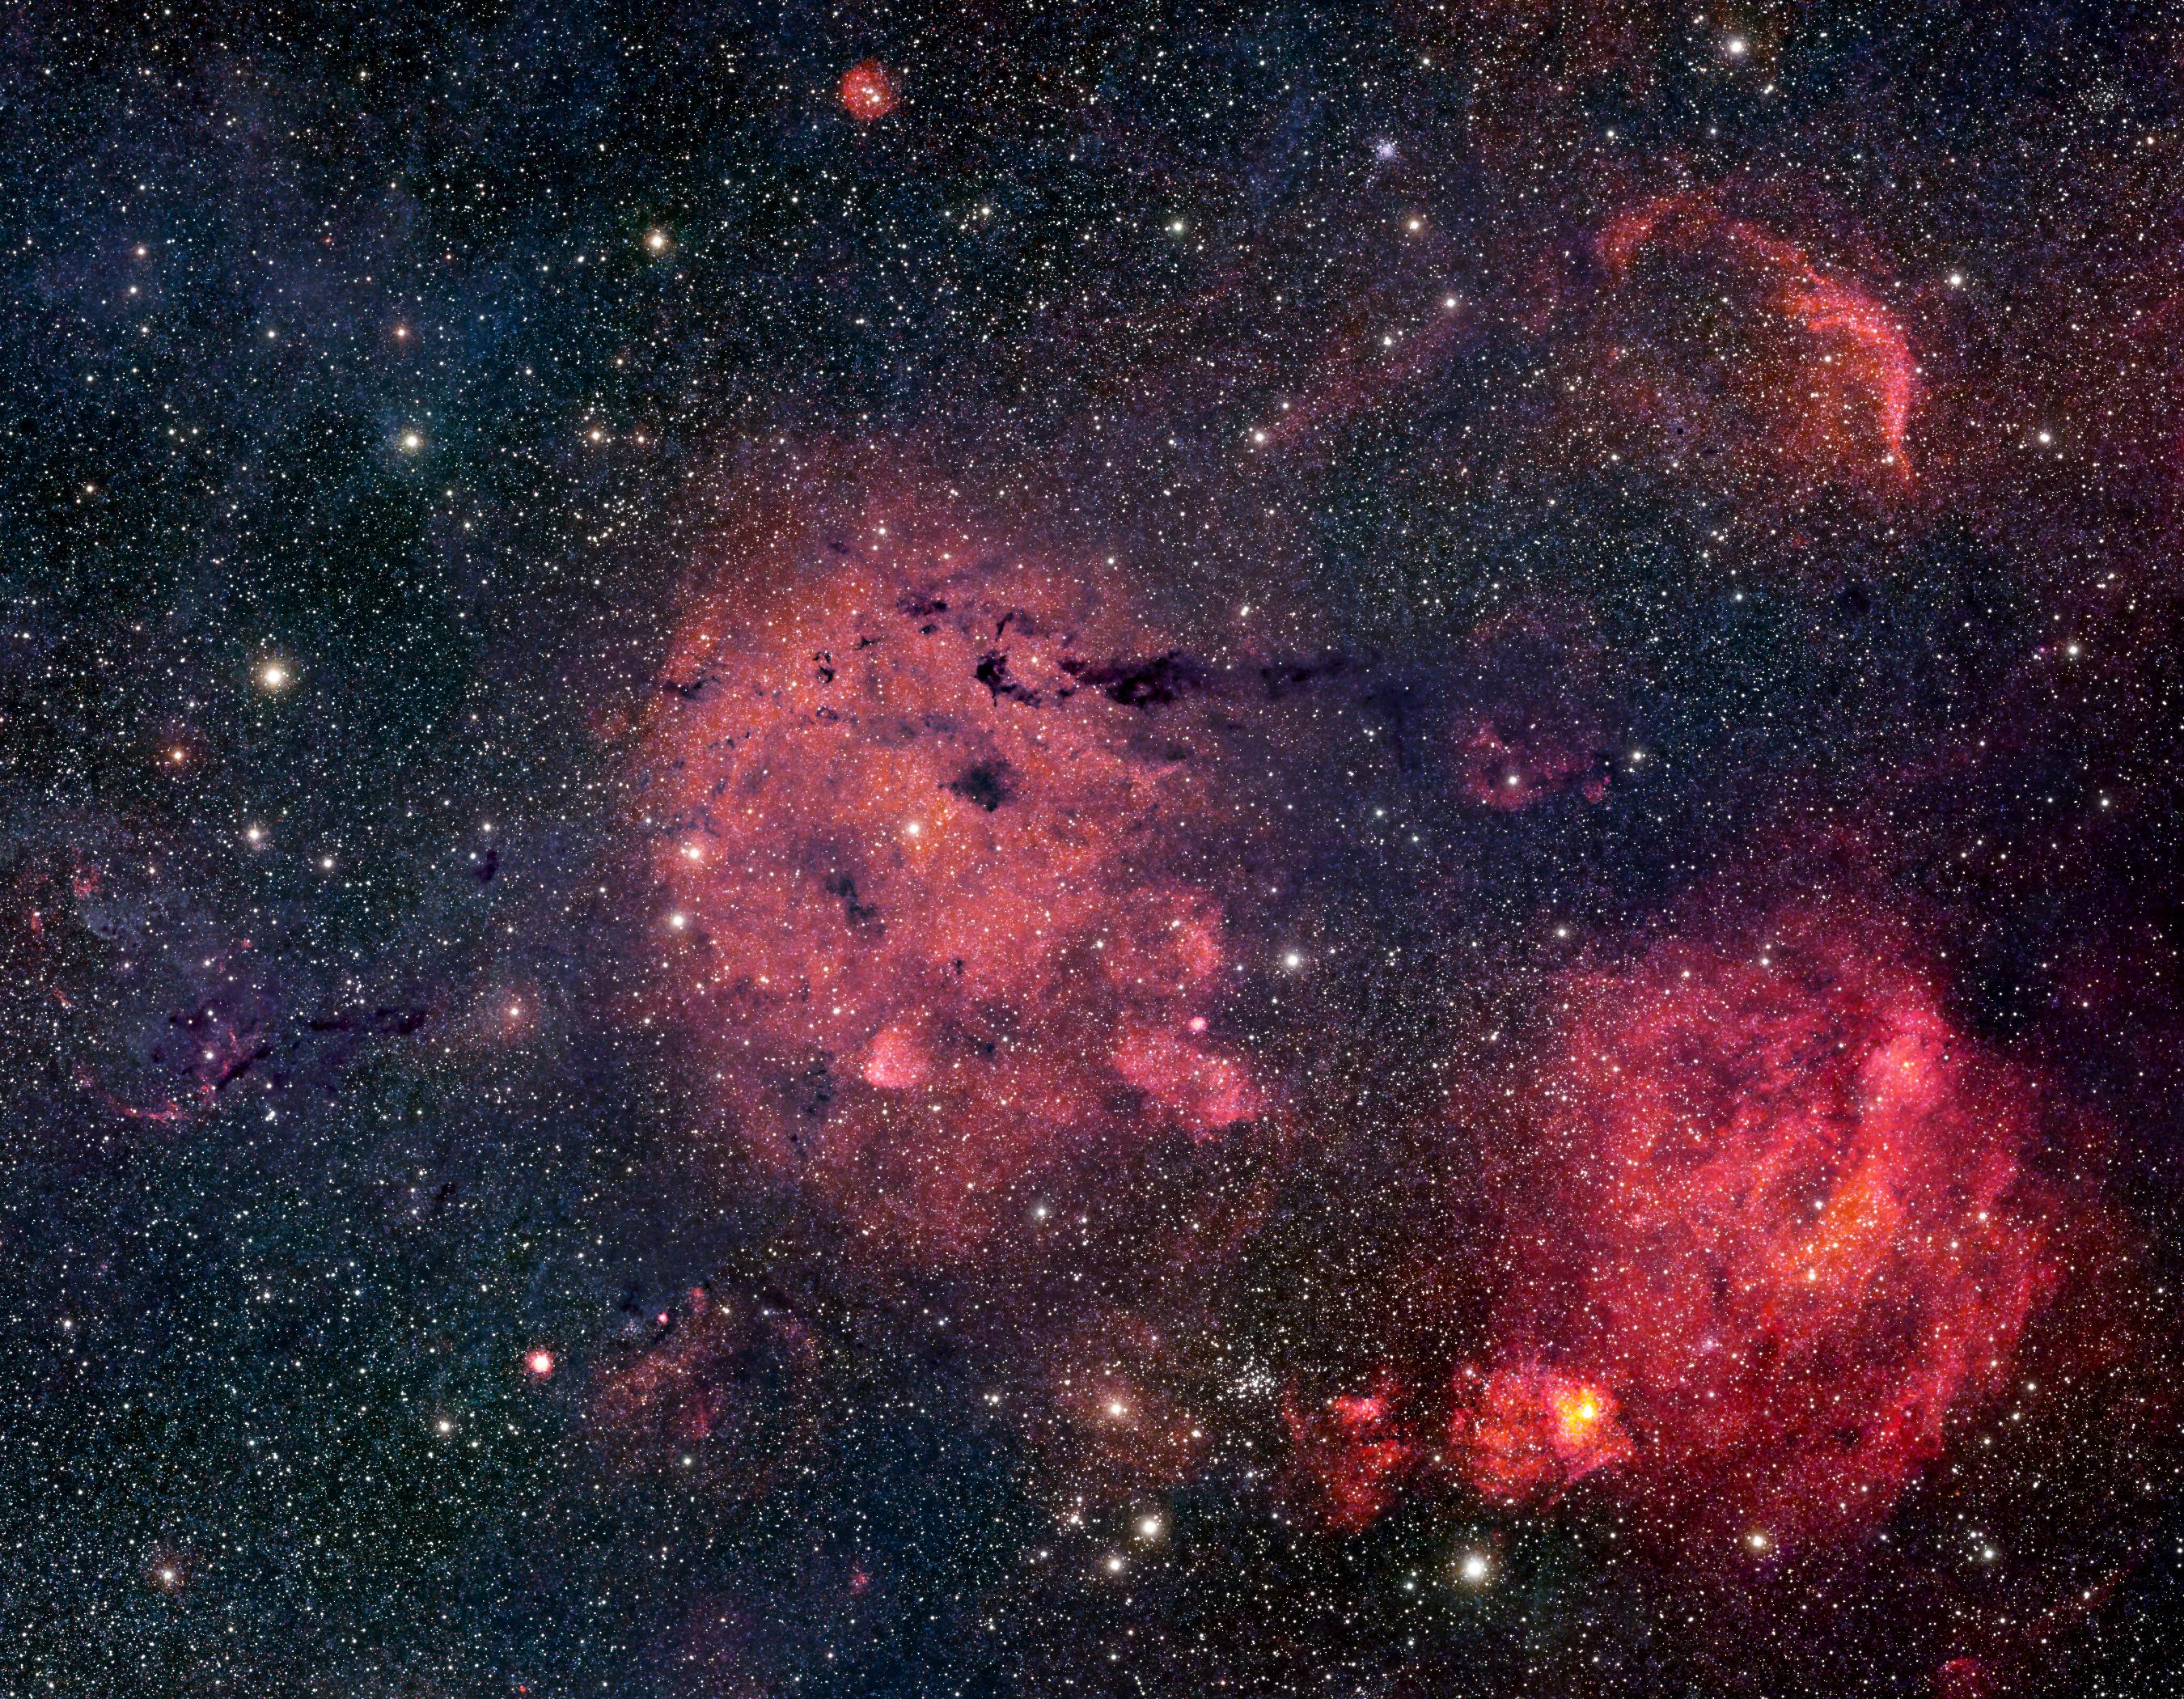
This visualization is a pseudo-color image that only uses the H-alpha data (including some red continuum). It shows many more details of the emission nebulae than the image above.
Color composition: After partial star subtraction, the dynamic range was compressed using a non-linear high-pass filter. This results in a compression ratio r, which is used to calculate the color as depicted in the legend.
(The legend shows the compression c:=1-r). Blue regions are compressed the least, while white regions are compressed the most. Luminance is determined by the tonal curve-corrected result of the dynamic range compression.
Due to the limited resolution of continuum channels, the image is only presented at half resolution.
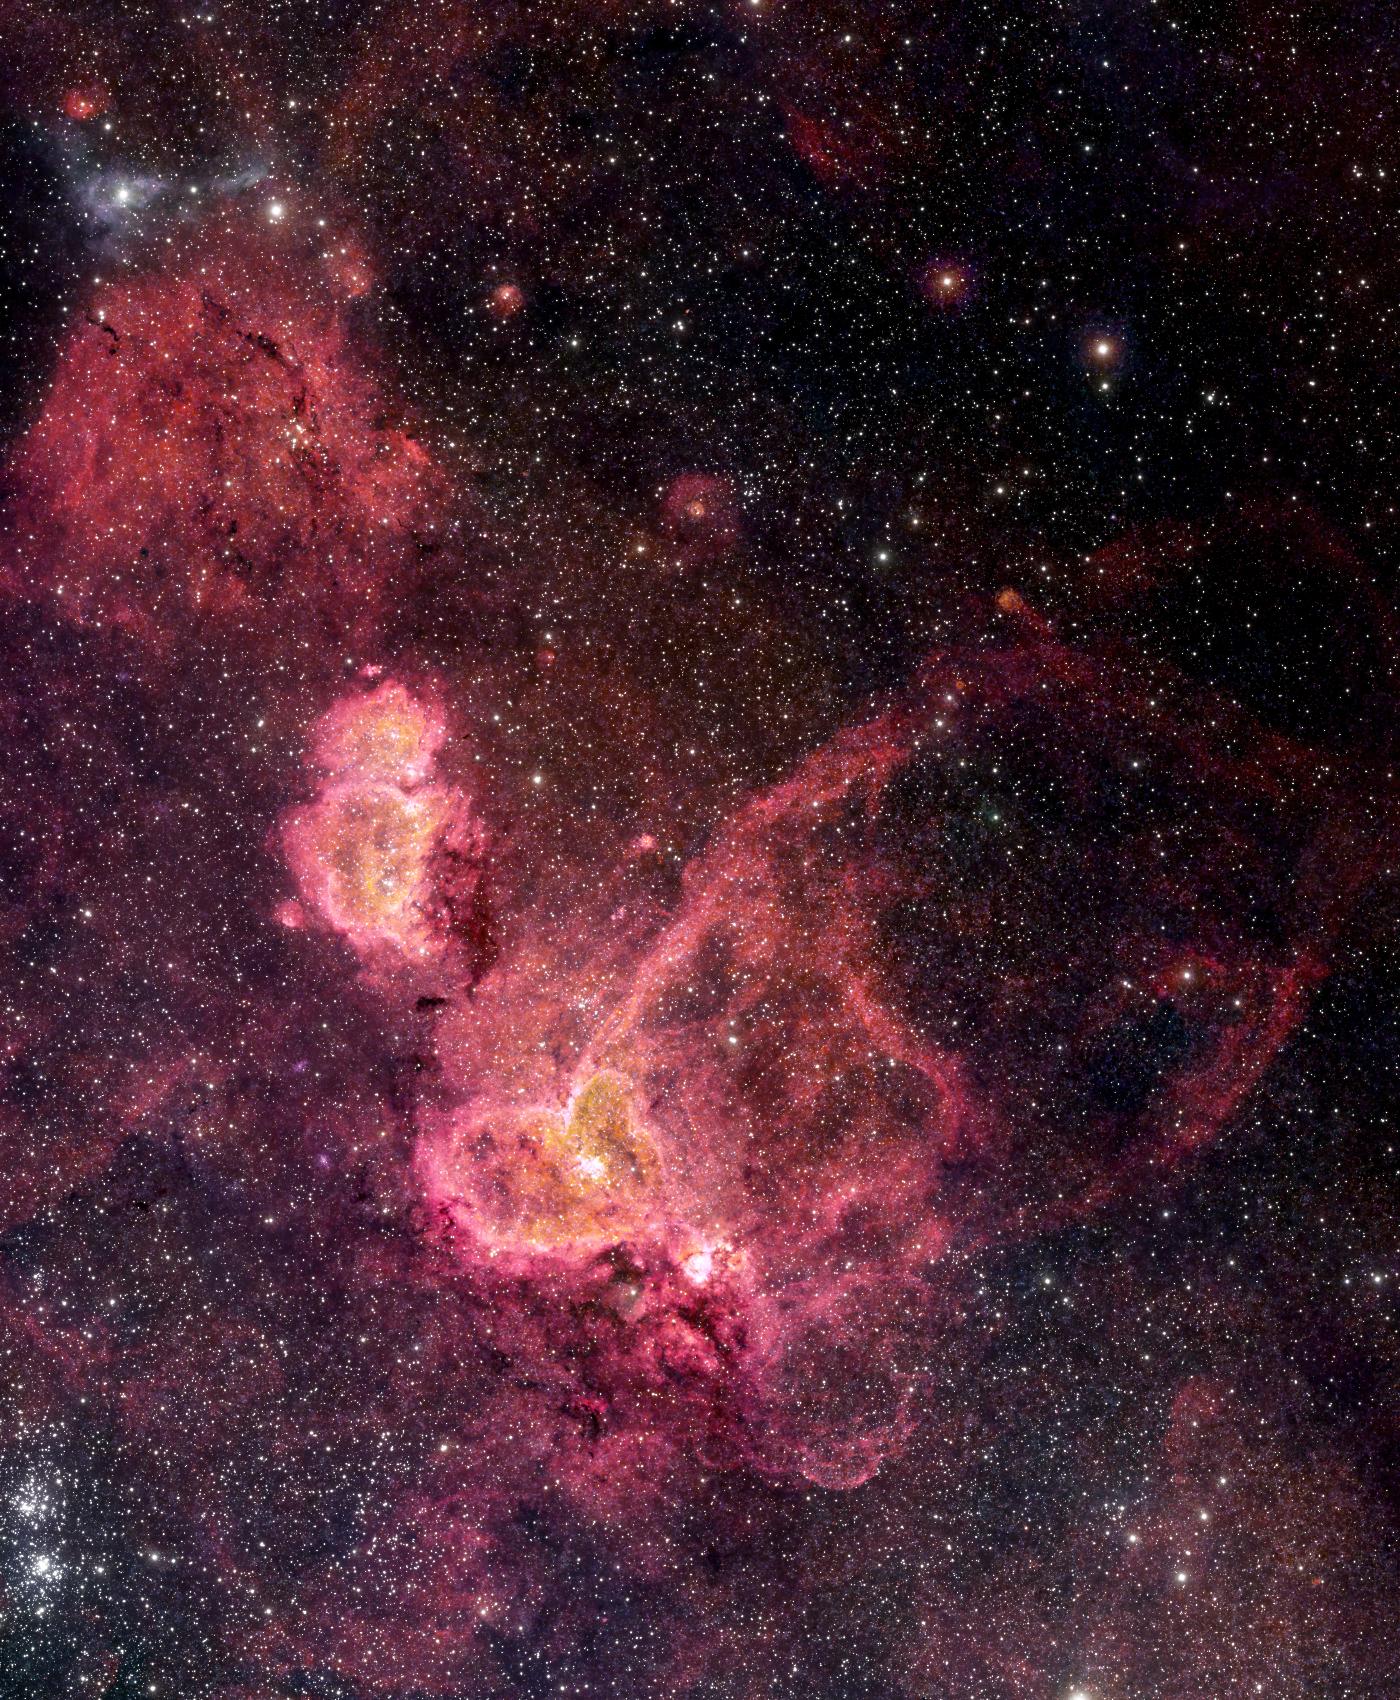
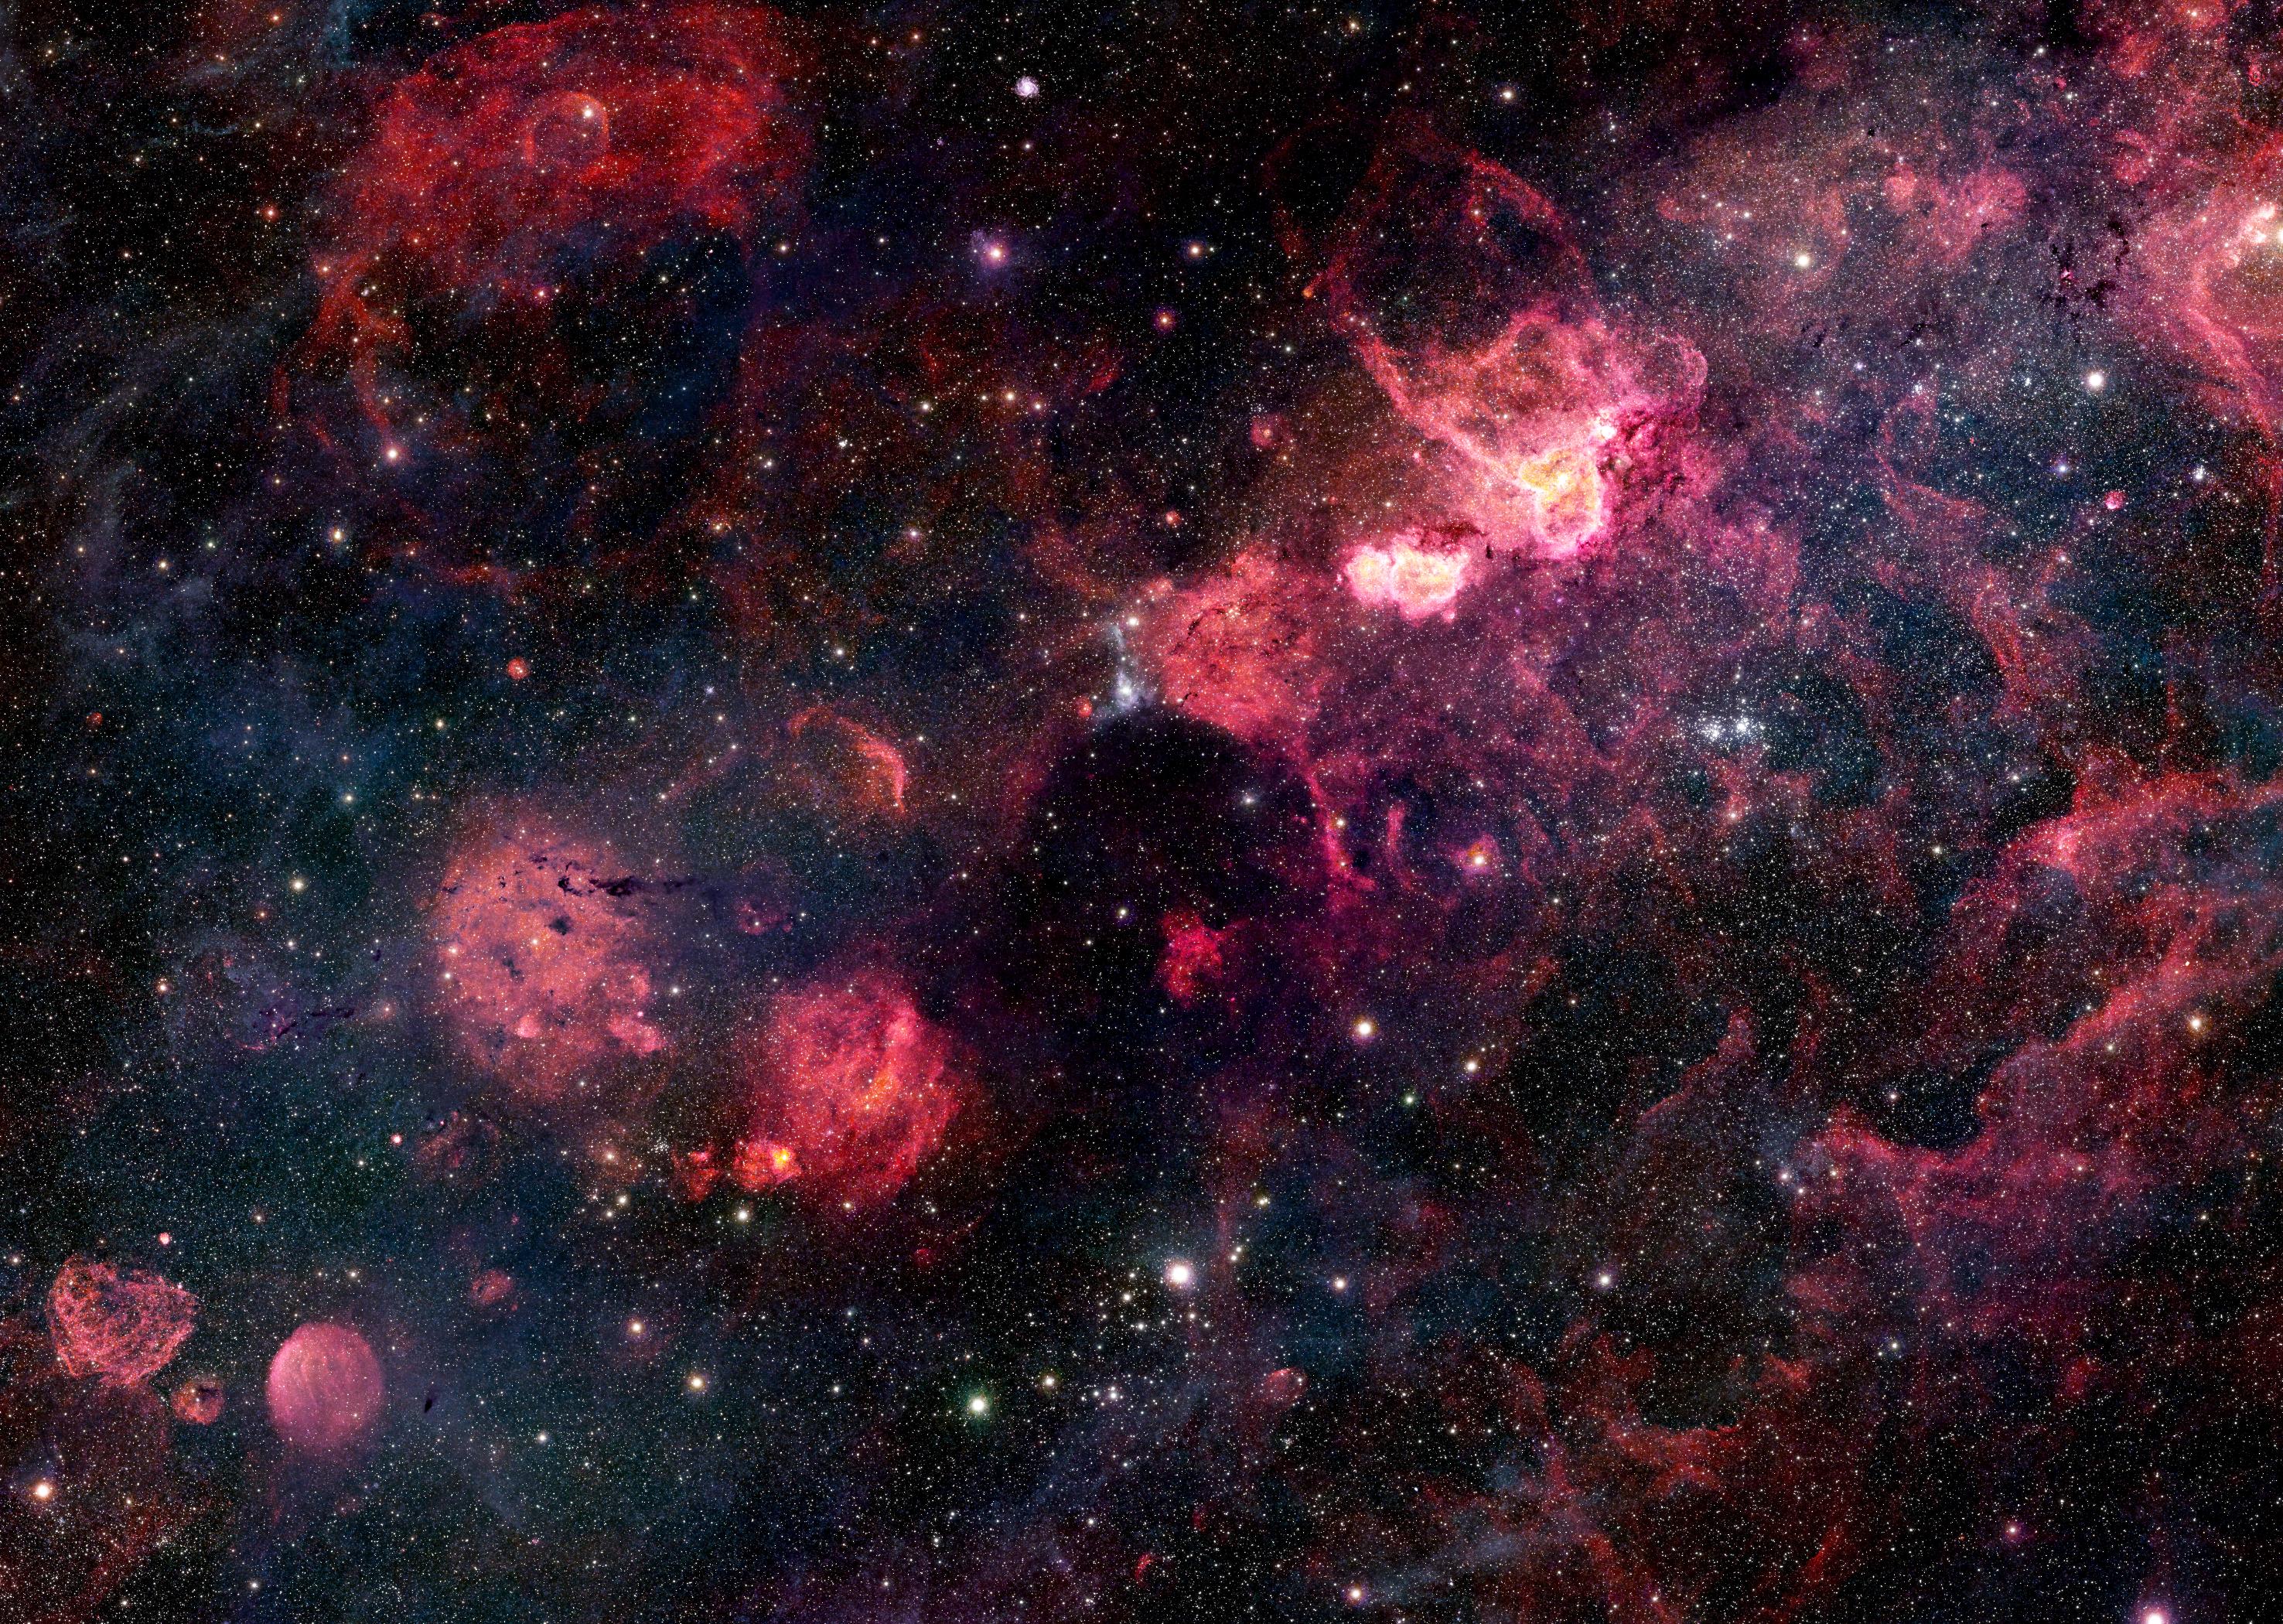
Selected details
Here are a few details that also can be seen using the JavaScript viewer.
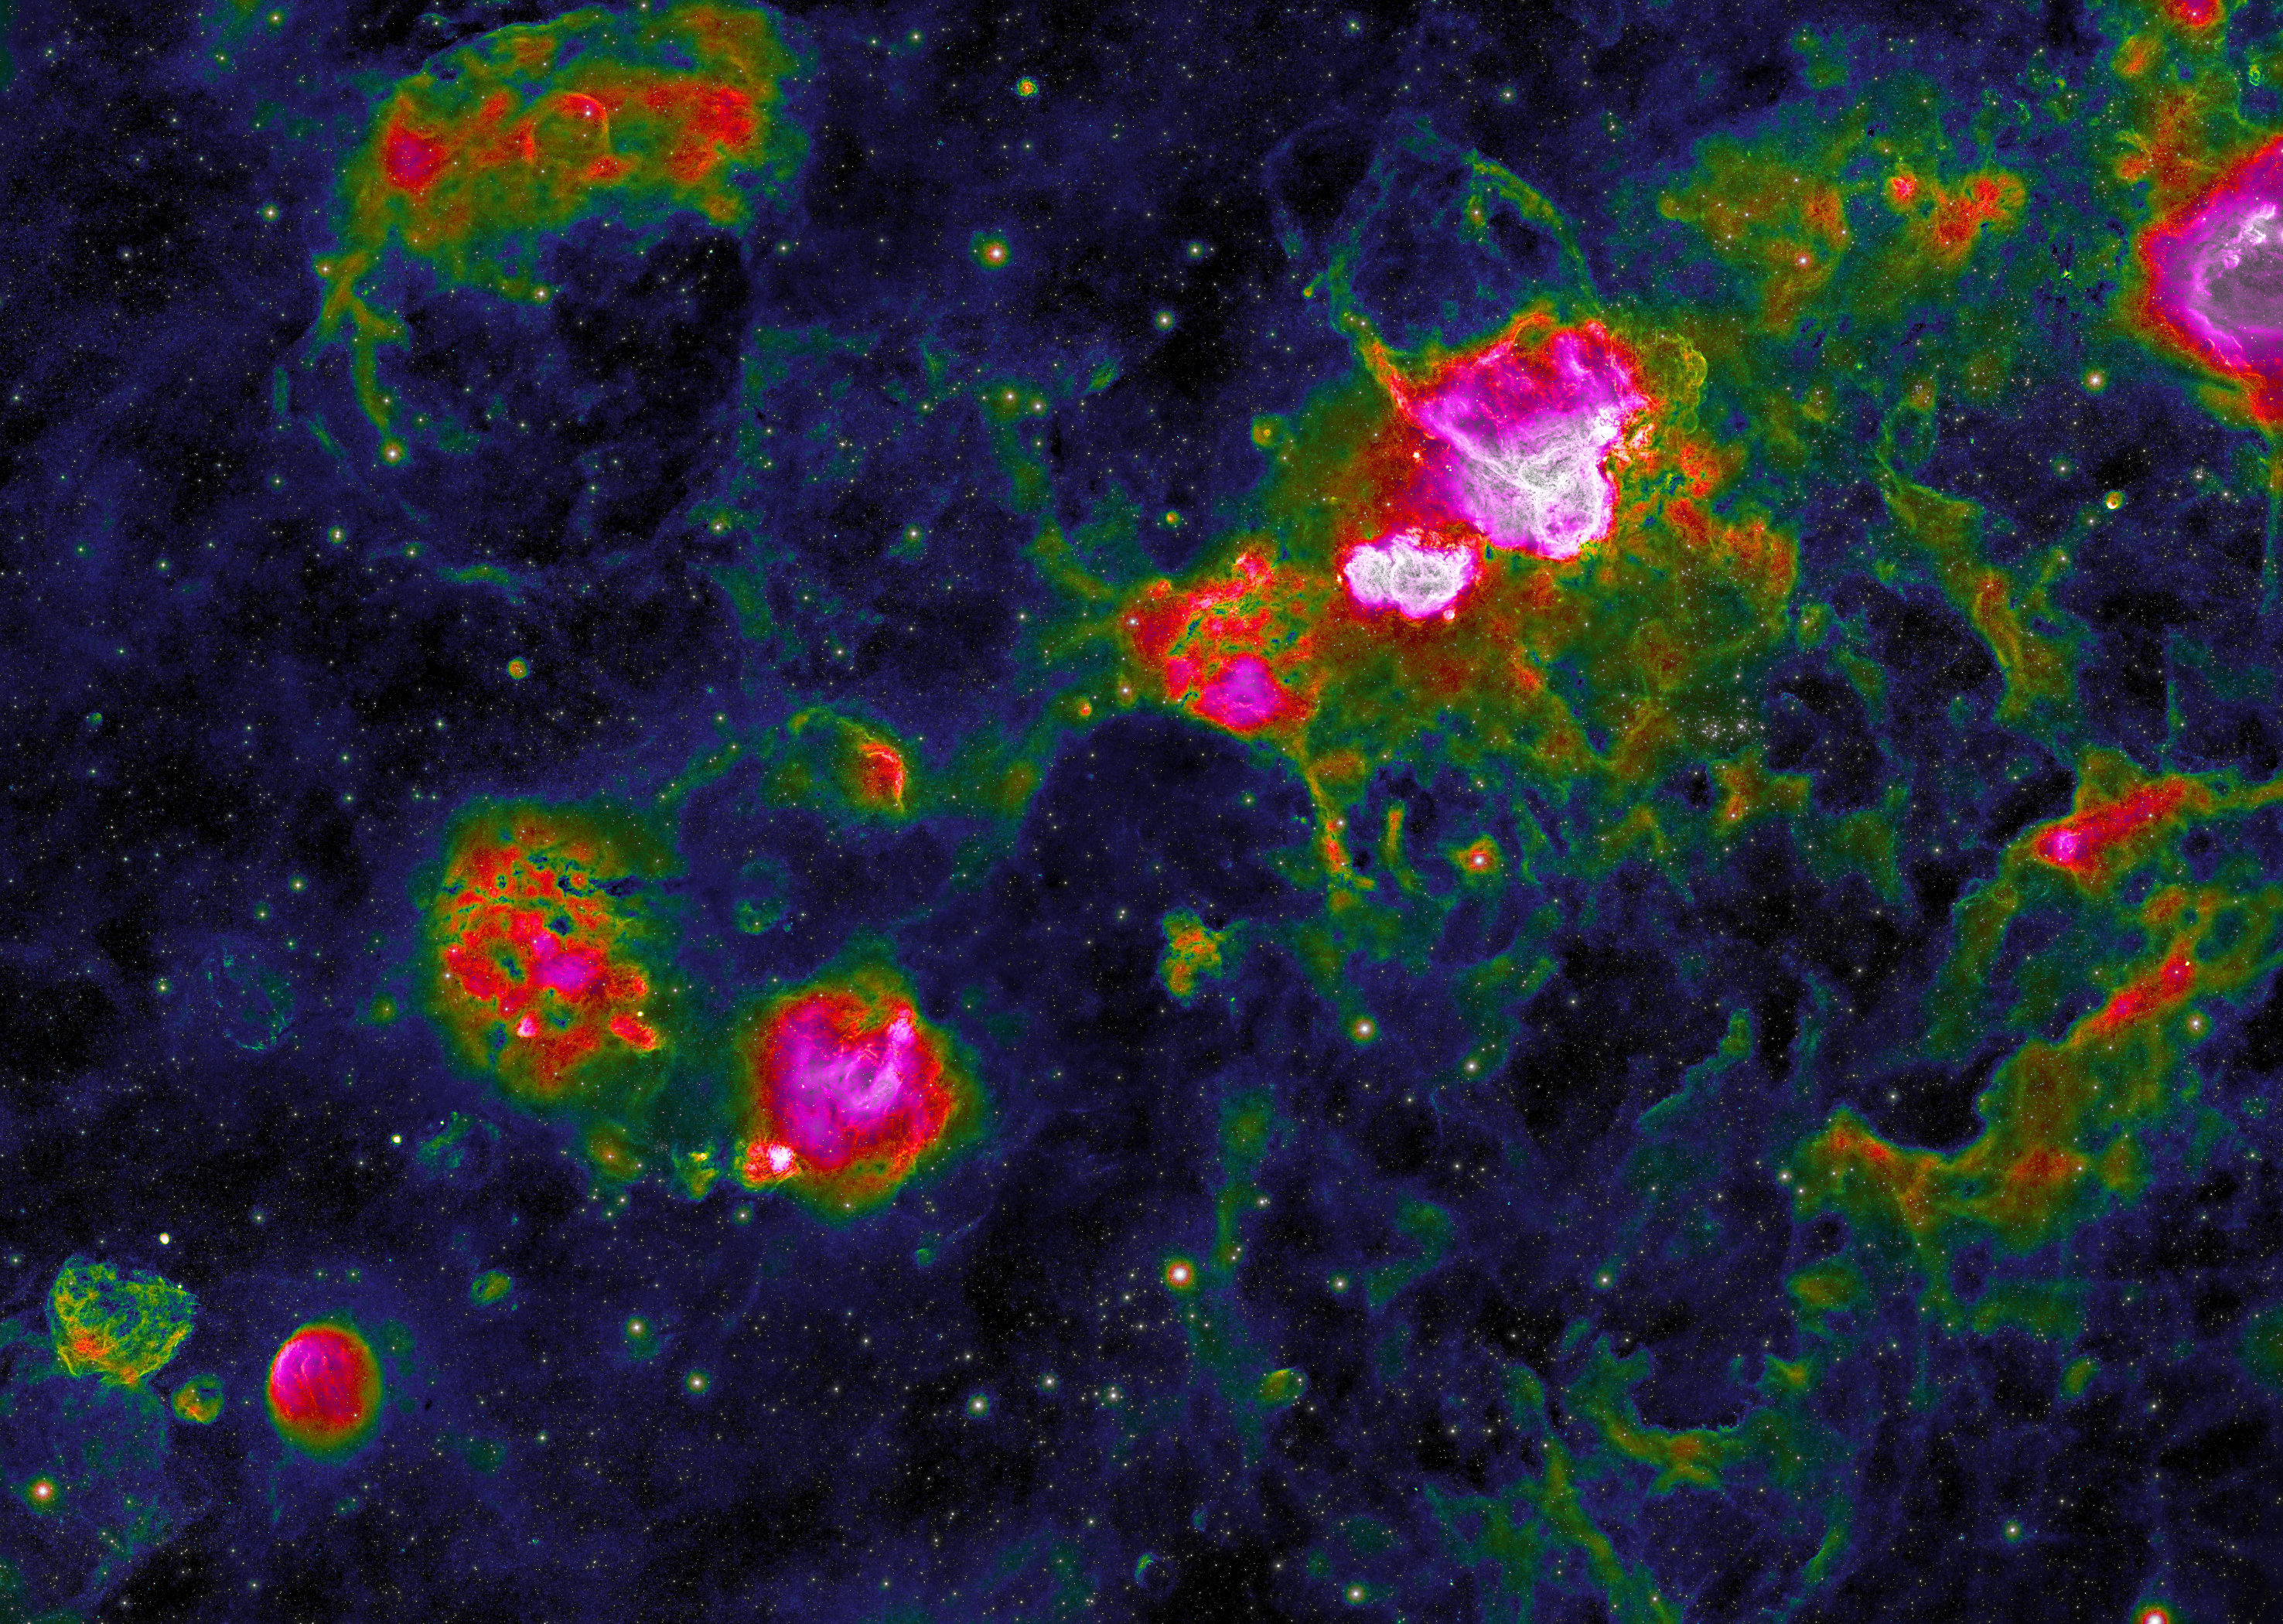
Discoveries
The views above show many HII regions that cannot be found in catalogs. (The JavaScript Viewer allows identifying objects using catalogs or SIMBAD and defining new objects.) Some (probably not all) of these unexplored nebulae have been collected in the list below. Click on the following links for a presentation.- C5, C10, H2-H7, DA1, D1-J16, JA1 in H-alpha and Continuum
- C5, C10, H2-H7, DA1, D1-J16, JA1 in H-alpha
- In the JavaScript viewer, the object outlines can be toggled on and off by pressing the '2' key. This can be helpful to make certain structures (e.g. rings) visible.
- False color images containing H-alpha and continuum:
- H-alpha is mapped to red, blue continuum is mapped to green, and red continuum (without H-alpha) is mapped to blue.
- Color of molecular clouds and reflection nebulae in the false color image is something between green (bluish in reality) and blue (reddish in reality).
- HII regions (ionized hydrogen) appear red to orange, depending on the amount of OIII (doubly ionized oxygen) detected by the blue continuum filter.
- SIMBAD queries for certain object types can be made easily in the JavaScript Viewer by drawing a circle and pressing a shortcut key or via the menu
- A repository with the discoveries can also be found on GitHub
Image data
Images where captured with a camera array which is described on the instruments page.Image data are:
| Projection type: | Stereographic | ||||
|---|---|---|---|---|---|
| Center position: | RA: 3h28m, DEC: 57° | ||||
| Orientation: |
| ||||
| Scale: | 10 arcsec/pixel (in center at maximum resolution) | ||||
| FOV: | 35°×25° (RA×DEC, through center) | ||||
| Exposure times: |
Sum of exposure times of all frames used to calculate the image.
|
Image processing
All image processing steps are deterministic. There was no manual retouching or any other kind of non-reproducible adjustment. No AI was used; the images shown here are the results of deterministic calculations and not hallucinations of an AI.Image processing steps where:
- Bias and dark current subtraction, flatfield correction, noise estimation
- Alignment and brightness calibration using stars
- Stacking with masking unlikely values and background correction
- Extracting stars from the emission line images using information from continuum images
- Denoising and deconvolution both components (stars and residual)
- RGB-composition (same factor for stars and residual for the true color composite)
- Dynamic range compression using non-linear high-pass filter
- Tonal curve correction
References
- [1]
- Dominic Lagrois and Gilles Joncas. On the Dynamical Evolution of H II Regions: An Investigation of the Ionized Component of W4, A Galactic Chimney Candidate. II. Kinematics and Dynamics in the Latitude Range 3°; < b <= 7°. ApJ, 693(1):186–206, March 2009. [ DOI ]
This work made use of the SIMBAD database, maintained by CDS, Strasbourg, France, and the Gaia public archive.
